Logs
Logs are indispensable for effective cluster management. They provide a chronological record of events, errors, state-changes and operational activity within your cluster. In a dynamic environment like Kubernetes, where pods start and stop frequently and pods may be rescheduled, timely access to logs enables you to diagnose issues, audit actions, ensure compliance and maintain visibility into system behaviour.
With KubeKit, you are empowered to access real-time log streams and leverage advanced features such as filtering, searching, timestamp viewing and downloading thereby transforming raw log data into actionable insights.
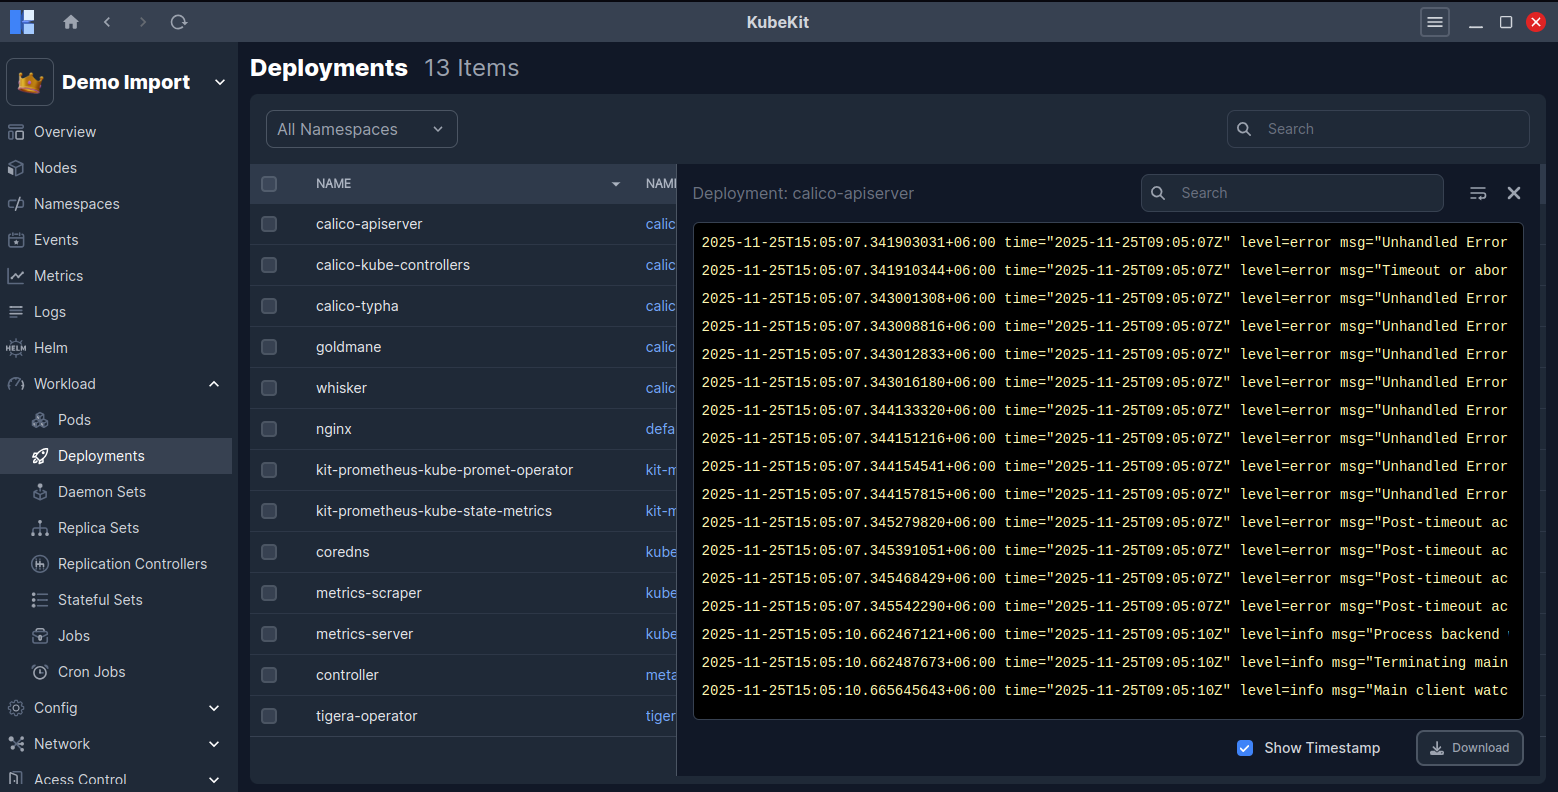
Individual Resource Logs
KubeKit allows you to view logs for individual resources such as pods, deployments, daemon sets and replica sets.
Also, you can view logs for replication controller, stateful set, jobs and cron jobs.
Central Log Management
From the KubeKit Cluster Dashboard, open the Logs section using the left-sidebar navigation.
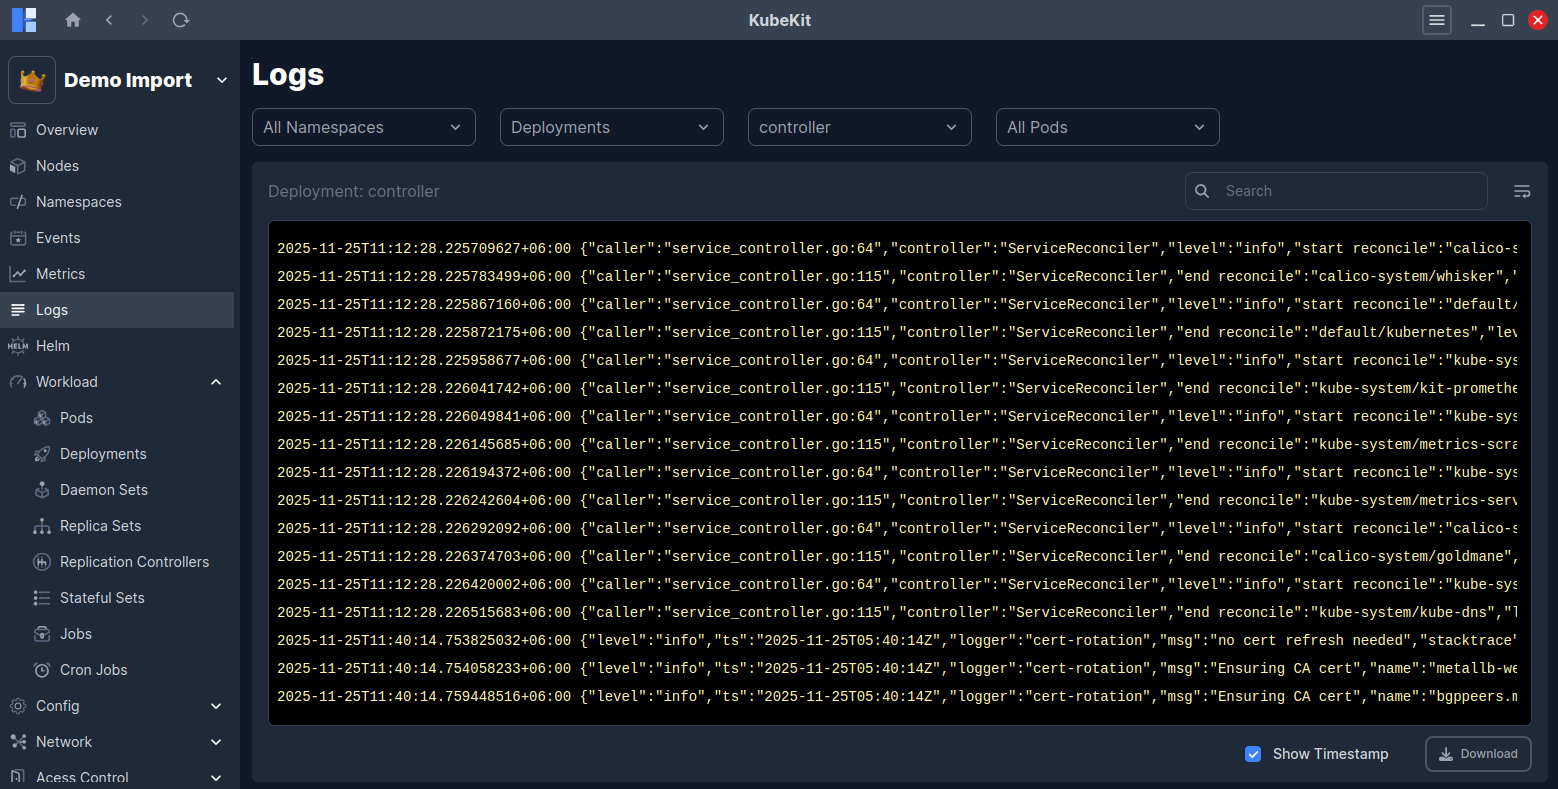
Filter Options
You can filter logs by namespace, deployment, replicaset, daemonset, replication controller, stateful set, job, node controller or pod. This enables you to narrow the scope of logs to the exact resource you wish to investigate.
Search Logs
Utilise the search bar with any text like error message, component name, keyword etc. This will highlight all the matched logs. You can also Wrap or Unwrap the full logs into the view. Also, you can show/hide the log timestamp by clicking on the Show Timestamp checkbox.
Download Logs
You can download the logs for further analysis or archival purposes by clicking on the Download button. This is particularly helpful for long-term investigations, auditing purposes or sharing with other teams.