Cluster Dashborad
KubeKit provides an intuitive UI interface to manage every aspect of your cluster including nodes, namespaces, events, metrics, logs, helm, workloads within a unified dashboard.
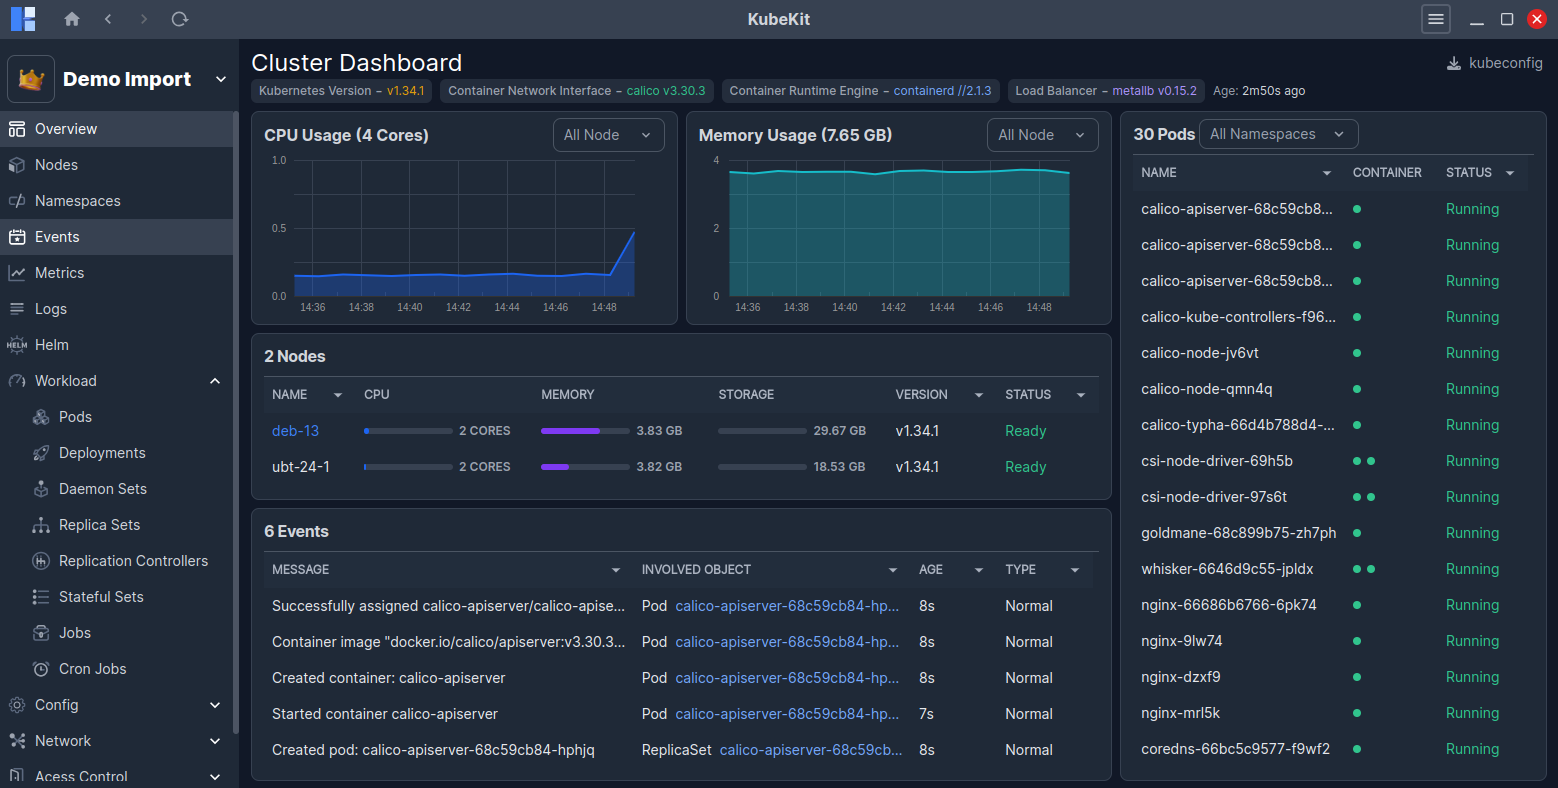
You can switch among clusters from top left dropdown.
At the top, the versions of Kubernetes, Container Network Interface, Container Runtime Engine, Load Balancer and Age of this cluster are shown.
At a glance, you will see:
- CPU and Memory usage of cluster nodes
- Node list (master node highlighted in blue).
- Recent event list, which occurred in your cluster.
- On the right side, all pods are listed.
You can manage pods, nodes and events directly via the Manage button available on hover.
All information on this page is updated in real time.
If metrics graphs are not visible then click on Configure metrics button and follow the instructions.